Turbocharge Your Python Code
A comprehensive guide to performance optimization techniques

Python has taken the world by storm with its elegant syntax, extensive libraries, and thriving community. Developers across the globe have embraced Python for a diverse range of applications — from web development to data analysis, artificial intelligence, and beyond.
Its popularity continues to soar as more developers adopt it for increasingly more extensive and intricate projects.
However, there’s the elephant in the room — Python’s speed. While Python is known for its simplicity, readability, and versatility, it has not earned the same acclaim regarding performance.
Due to its interpreted nature and the Global Interpreter Lock (GIL), Python often needs to catch up compared to languages like C, C++, or Java, which are compiled and better optimized for speed.
As more organizations choose Python for their critical projects, optimizing performance becomes an essential skill for developers. This article aims to help you tackle Python’s speed limitations head-on.
Through practical tips and examples, you’ll learn how to identify performance bottlenecks, optimize your code using best practices, and leverage various tools and techniques to ensure your Python applications run smoothly and efficiently.
Join us as we delve into Python performance optimization, empowering you to write faster and more efficient code and make the most of this influential and beloved programming language.
This article will first introduce tools to measure and profile your Python code. With these tools, we’ll examine the performance characteristics of various Python data structures.
Additionally, we’ll explore methods to optimize Python code and investigate whether increasing the number of threads or processes can lead to performance improvements.
All the source code for the examples presented can be found in a dedicated GitHub repository. This repository also includes a GitHub Action for building, testing, and verifying the Python code to ensure its quality and effectiveness.
Table of Contents
· Measuring Python performance
· Profiling Python code
∘ Using cProfile to profile the example
∘ Using line_profiler
∘ Using memory_profiler
· Which data structure is faster?
∘ Comparing Lists and Arrays
∘ Comparing Sets and Tuples
∘ Comparing Dataclass, Dictionary, and NamedTuple
· Optimizing Python Code
∘ For loop vs list comprehension
∘ String concatenation
∘ LBYL vs EAFP
∘ Generators vs List comprehensions
· Using threads and processes
∘ Using threads
∘ Using processes
· Conclusion
Measuring Python Performance
This section introduces practical tools and techniques for evaluating your code’s performance, laying the groundwork for future improvements.
To optimize your Python code effectively, it’s crucial to first measure its performance. This allows you to determine whether any modifications you make yield tangible improvements.
We’ll explore several straightforward methods for measuring the performance of your Python code, including the use of the time function, the pytest-benchmark plugin, and the timeit module.
Using the Python time function
We can use the time function to measure the duration of a code segment by calling it before and after the code and calculating the difference. See below for a simple example.
We record the start time in start_time before beginning the hashing process, and once it's complete, we record the end time in end_time.
By subtracting start_time from end_time, we obtain the time taken for the operation. In this example, we calculate the SHA1 hash of the string "Turbocharge Your Python Code" three million times.
def chain_sha1_hash(input_str, iterations):
    current_hash = input_str
    for _ in range(iterations):
        current_hash = hashlib.sha1(current_hash.encode()).hexdigest()
    return current_hash

if __name__ == "__main__":
    input_str = "Turbocharge Your Python Code"

    start_time = time.time()
    result = chain_sha1_hash(input_str, 3_000_000)
    end_time = time.time()

    elapsed_time = end_time - start_time
    print(f"Time taken: {elapsed_time:.2f} seconds")
Using pytest-benchmark
You can also leverage the pytest-benchmark plugin to effortlessly benchmark a function within your test suite. By running pytest, the plugin will automatically execute and benchmark the target function, providing a detailed performance analysis.
To use pytest-benchmark, install it using pip by running pip install pytest-benchmark. Next, create a test function that leverages the benchmark fixture, passing the target function and its arguments to the benchmark() call, as demonstrated below:
from measuring.time_function import chain_sha1_hash

def test_benchmark_chain_sha1_hash(benchmark):
    benchmark(chain_sha1_hash, "Turbocharge Your Python Code", 100_000)
In this example, we define a test function named test_benchmark_chain_sha1_hash that uses the benchmark fixture. Within the test function, we call benchmark() with chain_sha1_hash as the target function, followed by its input arguments: "Turbocharge Your Python Code" and 100,000 iterations. The plugin then runs several iterations of the function and reports the result.

Using the timeit module
Another option for measuring the performance of your Python code is to use the timeit module. The timeit function offers more accurate timing information by utilizing the best available clock on your system, such as the Python performance counter. This leads to better resolution compared to using the time module.
In addition, timeit can automatically execute multiple loops of your code snippet by adjusting the number parameter, which helps provide a more reliable performance measure. This is particularly useful for averaging out fluctuations in execution time caused by factors such as CPU load or other running processes.
Using the timeit module, you can achieve more precise and consistent performance measurements for your Python code. The example below uses the timeit module to benchmark the chain_sha1_hash function.
def chain_sha1_hash(input_str, iterations=100_000):
    current_hash = input_str
    for _ in range(iterations):
        current_hash = hashlib.sha1(current_hash.encode()).hexdigest()
    return current_hash

if __name__ == "__main__":
    input_str = "Turbocharge Your Python Code"

    elapsed_time = timeit.timeit(
        'chain_sha1_hash(input_str)',
        setup='from __main__ import chain_sha1_hash, input_str',
        number=10
    )

    result = chain_sha1_hash(input_str)

    print(f"Result: {result}")
    print(f"Time taken: {elapsed_time:.2f} seconds")
Profiling Python Code
In the previous section, we demonstrated simple measurement techniques for assessing your code’s performance. However, if you want more profound insights into the performance bottlenecks within your code, you may need more than just basic measurements. Profilers can help you examine your code more thoroughly.
Python includes two event-based profilers: profile and cProfile. The profile module, written in Python, has a significant overhead but can be easily extended. On the other hand, the cProfile module, written in C, is faster with lower overhead and serves as a general-purpose profiler.
When choosing between the two profilers, cProfile is generally preferred due to its reduced overhead and detailed performance measurements at the function level.
Using cProfile to profile the example
To utilize the cProfile profiler in your Python application, invoke it by adding the -m cProfile argument when running your script. Upon completion, the profiler will display various performance metrics related to your code.
The following screenshot demonstrates the outcome when profiling our chain_sha1_hash example using cProfile

The built-in profilers, profile and cProfile, are excellent starting points for profiling your Python code. However, it is essential to be aware of their limitations. Firstly, they can be slow and impose considerable overhead. Secondly, these integrated profilers are not designed to profile multithreaded applications.
Fortunately, the Python community has developed numerous external profilers that address these limitations, offering enhanced capabilities and performance insights.
Some of the most popular and widely-used external profilers for Python include:
- Py-Spy: A sampling profiler that works with minimal overhead and can profile native extensions and multithreaded applications.
- Yappi: A lightweight, multithreaded-aware profiler that provides call stack information and supports various output formats, including callgrind.
- line_profiler: A line-by-line profiler that measures the execution time of individual lines of code within a function.
- memory_profiler: A profiler focusing on memory usage, enabling you to track memory consumption throughout your application.
These tools provide enhanced functionality and overcome limitations inherent to the built-in profilers, positioning them as excellent alternatives for comprehensive performance analysis. In our upcoming examples, we will demonstrate the use of line_profiler and memory_profiler to showcase their capabilities.
Using line_profiler
To utilize line_profiler, you must first install it by running the command pip install line_profiler. After installation, a minor modification is required in your source code to enable the profiling of your application.
In particular, you must include the @profile decorator above the function you want to profile, as demonstrated below. This step ensures that the function is compatible with line_profiler.
@profile
def chain_sha1_hash(input_str, iterations):
    current_hash = input_str
    for _ in range(iterations):
        current_hash = hashlib.sha1(current_hash.encode()).hexdigest()
    return current_hash

if __name__ == "__main__":
    input_str = "Turbocharge Your Python Code"
    result = chain_sha1_hash(input_str, 100_000)
To profile the script using line_profiler, execute the command kernprof -lv time_function_line_profiler.py. The resulting profile will be displayed, as demonstrated in the example below. Take note of the ‘% Time’ column, which indicates the percentage of total execution time spent on each line of code.

Using memory_profiler
Memory Profiler is a Python tool that helps you monitor and analyze the memory usage of your Python programs. It provides insights into the memory consumption of your application throughout its execution, allowing you to identify memory leaks, inefficient memory usage, and other potential performance issues.
To use Memory Profiler, you typically need to install it via pip (pip install memory-profiler) and then decorate the functions you want to profile with the @profile decorator. After running your script with the Memory Profiler enabled, you will receive a detailed memory usage report, including line-by-line analysis for the profiled functions, allowing you to pinpoint memory-intensive areas in your code and optimize them accordingly.
Let’s apply Memory Profiler to our example. Observe how Memory Profiler displays the memory usage for each line in our example, providing valuable insights into the memory consumption of the code.

We now possess a comprehensive set of tools and methodologies that enable us to thoroughly examine Python’s diverse data structures and determine the optimal choice for specific situations.
Which Data Structure Is Faster?

This section will examine and evaluate a range of Python data structures to assess their performance in different scenarios.
Our analysis will begin by comparing lists and arrays and exploring sets and tuples. Subsequently, we will investigate dictionaries, data classes, and named tuples.
Comparing lists and arrays
Lists and arrays are valuable tools for organizing multiple items within a single structure. Lists, in particular, are a widely-used Python data structure.
A list represents an ordered collection of items, each with a specific position in the sequence. Lists can contain items of mixed types, such as integers and strings combined within the same list.
However, storing items of the same type in a list for performance optimization is recommended, allowing Python to perform certain enhancements behind the scenes.
Let’s compare the performance of a NumPy array and a Python list by executing the following code. Rather than using the command line tool line_profiler, we’ll incorporate the LineProfiler module directly into our source code.
We’ll create an array and a list containing 10 million random numbers and then multiply each number by two in both the list and the array.
def double_list(initial_list):
    return [x * 2 for x in initial_list]

def double_array(initial_array):
    return initial_array * 2

size = 10_000_000
initial_list = [random.randint(0, 100) for _ in range(size)]
initial_array = np.random.randint(0, 100, size)

lp = LineProfiler()
lp.add_function(double_list)
lp.add_function(double_array)

lp.runctx('double_list(initial_list)', globals(), locals())
lp.runctx('double_array(initial_array)', globals(), locals())

lp.print_stats()
Upon executing the script and investigating the output, doubling the elements in the Python list requires 0.768 seconds, while the same operation on the NumPy array takes only 0.012 seconds. This indicates that the NumPy array is roughly 64 times faster than the Python list.
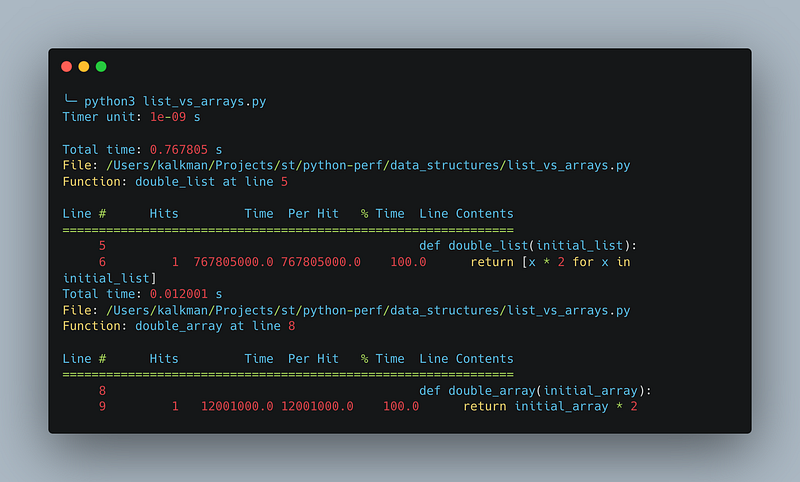
In summary, NumPy arrays offer substantial performance enhancements over lists for numerical computations, particularly when working with large data sets.
Comparing sets and tuples
Sets and tuples are alternative data structures to lists in Python. Sets are unordered collections with unique items, offering fast operations like adding, deleting, and membership checking. They are well-suited for situations requiring checking if items are part of a large collection.
Tuples, on the other hand, are ordered, immutable collections similar to read-only lists. They are more lightweight and memory-efficient than lists but offer limited functionality.
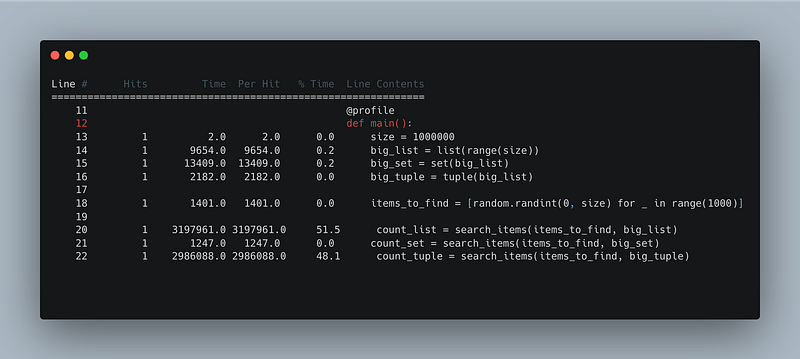
Let’s analyze the following script, which generates a list, a set, and a tuple, each containing one million elements. It then searches 1,000 times for a random number within each data structure.
@profile
def search_items(items_to_search, collection):
    count = 0
    for item in items_to_search:
        if item in collection:
            count += 1
    return count

@profile
def main():
    size = 1000000
    big_list = list(range(size))
    big_set = set(big_list)
    big_tuple = tuple(big_list)

    items_to_find = [random.randint(0, size) for _ in range(1000)]

    count_list = search_items(items_to_find, big_list)
    count_set = search_items(items_to_find, big_set)
    count_tuple = search_items(items_to_find, big_tuple)

    print(f"Found {count_list} items in list")
    print(f"Found {count_set} items in set")
    print(f"Found {count_tuple} items in tuple")

if __name__ == "__main__":
    main()
We run the line profiler again.
Creating the data structures (list, set, and tuple) took a small portion of the total execution time. Most of the time was spent searching for the random integers in the list and tuple, with the search in the list taking 51.5% of the total time and the search in the tuple taking 48.1% of the total time.
Searching in the set was significantly faster, taking only 1,247 microseconds.
We also run the memory profiler on the same code, which gives the following result.
Creating the list, set, and tuple increased the memory usage to 60.203 MiB, 122.750 MiB, and 130.391 MiB, respectively. The most memory-intensive data structure was the set, with an increment of 62.547 MiB, followed by the list, with an increment of 38.25 MiB, and the tuple, with an increment of 7.641 MiB.

To summarize the results, when searching for items in a big collection, sets will be extremely fast, tuples will consume the least memory, and lists will offer the most flexibility.
Comparing Dataclass, Dictionary, and NamedTuple
In this section, we will compare three popular data structures in Python: Data classes, Dictionaries, and Named Tuples.
Data classes, introduced in Python 3.7, allow you to easily create classes primarily used for storing data with minimal boilerplate code.
Dictionaries are versatile and widely-used data structures for storing key-value pairs, offering fast access and manipulation of data.
On the other hand, Named Tuples is a more readable and memory-efficient alternative to regular tuples, as they provide named fields to access elements.
By comparing these data structures, we will gain insights into their performance and use cases to make informed decisions when choosing the right one for specific tasks.
We again use the line profiler to profile the script's performance.
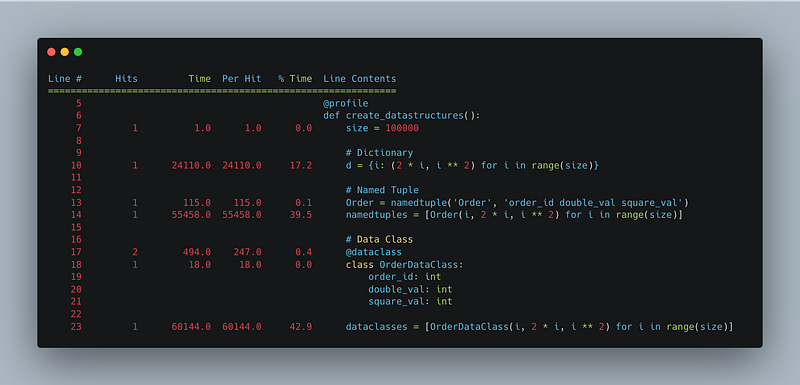
@profile
def create_datastructures():
    size = 100000

    # Dictionary
    d = {i: (2 * i, i ** 2) for i in range(size)}

    # Named Tuple
    Order = namedtuple('Order', 'order_id double_val square_val')
    namedtuples = [Order(i, 2 * i, i ** 2) for i in range(size)]

    # Data Class
    @dataclass
    class OrderDataClass:
        order_id: int
        double_val: int
        square_val: int

    dataclasses = [OrderDataClass(i, 2 * i, i ** 2) for i in range(size)]

    return d, namedtuples, dataclasses

def main():
    create_datastructures()

if __name__ == "__main__":
    main()
The following results demonstrate that dictionaries offer the fastest creation times (17%), followed by named tuples (39.5%), while data classes come last in speed (42.9)%.
This wraps up our examination and comparison of some of Python's popular data structures’ performance. Moving forward, we will explore and analyze various concrete approaches for optimizing code in Python.
Optimizing Python Code

In the following section, we will explore and compare the performance of various Python programming constructs and techniques, including “For loop vs list comprehension,” “String concatenation,” “Permission or forgiveness,” and “Generators.”
These comparisons will provide insights into the efficiency of each approach, allowing you to make informed decisions when optimizing your Python code.
For loop vs list comprehension
In Python applications, preparing input data, processing items, and returning the output as a new collection is common. Two popular approaches for these tasks are for-loops and list comprehensions.
For-loops provide flexibility, making them suitable for more complex business logic; however, they can be lengthy and slower than list comprehensions for simpler tasks. In contrast, list comprehensions are concise, fast, and great for straightforward logic but offer less flexibility.
In the following example, we compare the performance of a for-loop and a list comprehension to assess their relative efficiency. We will use the line profiler to profile the code and analyze the results.
def for_loop(orders: List[int]) -> List[int]:
    result = []
    for amount in orders:
        if amount > 50:
            result.append(amount * 2)
    return result

def list_comprehension(orders: List[int]) -> List[int]:
    return [amount * 2 for amount in orders if amount > 50]

@profile
def main():
    orders = [random.randint(0, 100) for _ in range(100000)]
    for_loop_result = for_loop(orders)
    list_comprehension_result = list_comprehension(orders)

if __name__ == "__main__":
    main()
String concatenation
In Python, there are several methods to concatenate strings. These are the most common.
- Using the
+operator: The+operator can concatenate two or more strings. This method is simple and intuitive but inefficient when concatenating many strings. - Using the
join()method: Thejoin()method combines multiple strings from an iterable (such as a list or tuple) into a single string. It is more efficient than the+operator, especially when concatenating many strings. - Using string interpolation: String interpolation is a technique that allows you to embed variables within a string. In Python, you can use f-strings,
str.format(), or the%operator to perform string interpolation. This method is particularly useful when including variables or expressions within a string.
The following example demonstrates the performance difference between the + operator and the join() method when concatenating 10,000 strings.
def random_string(length):
    return "".join(random.choices(string.ascii_lowercase, k=length))

def plus_operator(strings):
    result = ""
    for s in strings:
        result += s
    return result

def join_method(strings):
    return "".join(strings)

@profile
def main():
    strings = [random_string(10) for _ in range(10000)]

    plus_operator(strings)
    join_method(strings)

if __name__ == "__main__":
    main()
Based on the profiling results, the join_method() is significantly faster than the plus_operator() method for concatenating strings in this scenario.

LBYL vs EAFP
This section will research the performance of two distinct coding styles. The first approach, Look Before You Leap (LBYL), involves checking whether a given condition is met before performing an operation.
Conversely, the second approach, Easier to Ask for Forgiveness than Permission (EAFP), entails directly executing the operation and handling any potential exceptions that might arise if the preconditions are not satisfied.
You probably know the routine by now. As usual, we first construct an example to compare the two coding styles and then profile it using the line profiler.
In the example, we create a dictionary containing 100,000 items. We then employ both approaches to retrieve a value from the dictionary.
The LBYL version first checks if the key is present in the dictionary before returning the value, whereas the EAFP version attempts to return the value directly and handles any exceptions that may arise.
It’s important to mention that we’ve introduced a hit_ratio parameter in the example. This parameter determines the proportion of times the key will be present in the dictionary.
We will explore its impact on the performance of the two coding styles later in the analysis.
import random
import string
# Generate a large dataset
data = {"".join(random.choices(string.ascii_lowercase, k=10)):
random.randint(1, 100) for _ in range(100000)}
@profile
def lbyl_style(key, data):
if key in data:
return data[key]
return None
@profile
def eafp_style(key, data):
try:
return data[key]
except KeyError:
return None
def main(hit_ratio):
# Generate a list of random keys, some of which may not be in the dataset
num_keys_to_check = 10000
num_present_keys = int(num_keys_to_check * hit_ratio)
num_missing_keys = num_keys_to_check - num_present_keys
present_keys = random.sample(list(data.keys()), num_present_keys)
missing_keys = ["".join(random.choices(string.ascii_lowercase, k=10))
for _ in range(num_missing_keys)]
keys_to_check = present_keys + missing_keys
random.shuffle(keys_to_check)
for key in keys_to_check:
lbyl_style(key, data)
eafp_style(key, data)
if __name__ == "__main__":
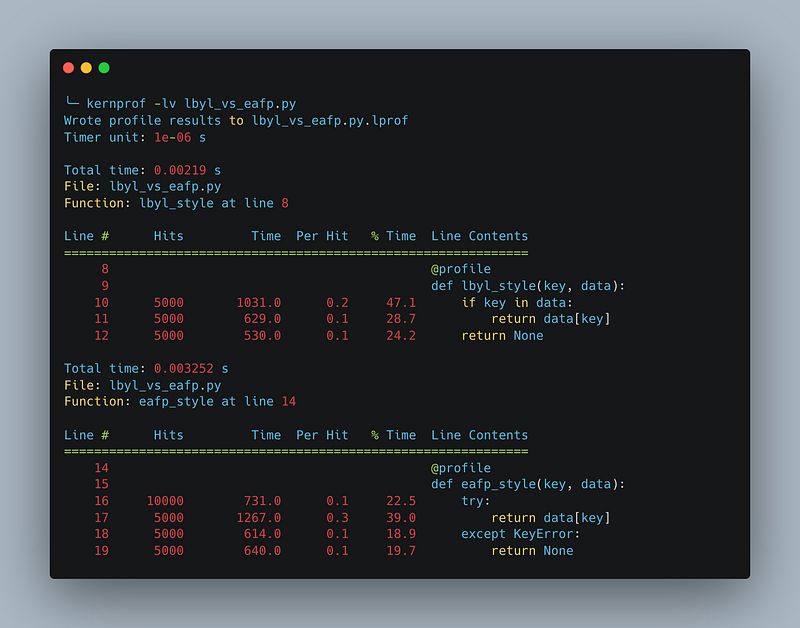
main(hit_ratio=0.5) # You can adjust this value to change the ratio of keys present in the dataset.With a 50% hit ratio, the LBYL approach (lbyl_style function) takes a total time of 0.0022 seconds. The EAFP approach (eafp_style function) takes a total time of 0.003345 seconds, which is longer than the LBYL approach.
With a 50% hit ratio, the LBYL approach is faster than the EAFP approach.
However, it’s important to note that performance may vary depending on the context, data distribution, and hit ratio. The EAFP approach might perform better as the hit ratio increases since exception handling would be less frequent.
Let’s put this to the test with an additional example. In this scenario, we vary the hit ratio from 0% to 100% and utilize Matplotlib to generate a graph to show the performance difference between LBYL and EAFP.
The graph demonstrates that the EAFP style’s performance improves as the hit ratio increases, while the LBYL style’s performance remains relatively stable.

In general, it’s crucial to profile and analyze the performance of both approaches in the context of the specific problem you’re trying to solve and consider the hit ratio in the dataset.
Generators vs List comprehensions
Generator expressions and list comprehensions are both methods in Python for processing collections of items. While generator expressions are considered “lazy” versions of list comprehensions, they generate values on-the-fly when needed, making them more memory-efficient, particularly for large datasets.
However, there are some limitations to generator expressions. They only allow for a single iteration and do not support random item access. In contrast, list comprehensions create an entirely new memory list, enabling multiple iterations and random item access. The trade-off is that list comprehensions generally require more memory than generator expressions.
Let’s construct an example to compare the memory consumption of both generator expressions and list comprehensions.
In this script, we first generate a list of random numbers. Then, we define two functions, list_comprehension() and generator_expression(), to compute the squares of the numbers using a list comprehension and a generator expression, respectively. We use the @profile decorator to enable memory profiling for these functions.
def random_numbers(n):
    return [random.randint(1, 100) for _ in range(n)]

@profile
def list_comprehension(numbers):
    return [x ** 2 for x in numbers]

@profile
def generator_expression(numbers):
    return (x ** 2 for x in numbers)

def main():
    numbers = random_numbers(1000000)
    squared_numbers_list = list_comprehension(numbers)
    squared_numbers_gen = generator_expression(numbers)

if __name__ == "__main__":
    main()
Based on the memory profiler results below, the list comprehension consumes significantly more memory than the generator expression. The memory consumption increased by 40.641 MiB when using the list comprehension, whereas the generator expression did not increase memory usage.
This is because the list comprehension creates a new list in memory containing all squared numbers. At the same time, the generator expression only generates the squared numbers on-the-fly as needed, without storing them in memory.

In situations where memory efficiency is a priority, and the limitations of generator expressions (such as single-pass iteration and lack of random access) are not an issue, using generator expressions can be more suitable than list comprehensions.
Using Threads and Processes

This section investigates how we can improve Python application performance using threads and processes.
Threads and processes differ: threads are more lightweight, faster to create, and share memory space, which can lead to potential bugs when multiple threads modify the same variable. On the other hand, processes require more resources and have separate memory, making them less prone to bugs but more challenging for data exchange.
Threads represent separate execution flows within a process and can perform concurrent tasks. However, Python’s Global Interpreter Lock (GIL) limits the performance boost of multithreaded code.
We will first look at threads and then move to processes.
Using threads
To use threads in Python, the threading module is employed. There are two approaches for creating threads: subclassing the Thread class or using the Thread function with a target argument.
Let's look at a simple example demonstrating how threads can improve performance in a Python application. Our example will use the Thread function.
In this example, the code downloads the same set of images twice, first sequentially and then using threads. The performance improvement is calculated by comparing the time taken for each method.
Downloading images is an I/O-bound task, and Python threads can provide significant performance improvements in these cases.
import threading
import urllib.request
import time

def download_image(image_url, save_as):
    print(f"Downloading {image_url}...")
    urllib.request.urlretrieve(image_url, save_as)
    print(f"Downloaded {image_url} as {save_as}.")

base_url = "https://commons.wikimedia.org/wiki/Special:NewFiles#/media/File:"
image_urls = [
    base_url + "Christopher_Street_Day_Berlin_2019_510.jpg",
    base_url + "CSD_Frankfurt_Slubice_2021_029.jpg",
    base_url + "21.04.2023_MUC-Stammtisch-Erkundung_18.jpg",
    base_url + "SAZANKA_STREET_(52478707745).jpg",
]

start_time = time.time()

for i, image_url in enumerate(image_urls):
    download_image(image_url, f"image{i+1}.jpg")

sequential_time = time.time() - start_time
print(f"\nSequential download time: {sequential_time:.2f} seconds\n")

start_time = time.time()

threads = []

for i, image_url in enumerate(image_urls):
    thread = threading.Thread(target=download_image, args=(image_url, f"image_threaded{i+1}.jpg"))
    threads.append(thread)
    thread.start()

for thread in threads:
    thread.join()

multithreaded_time = time.time() - start_time
print(f"\nMultithreaded download time: {multithreaded_time:.2f} seconds\n")

print(f"Performance improvement using threads: {sequential_time/multithreaded_time:.2f} times")
On my machine and my internet connection, the sequential download took 2.48 seconds, while the multithreaded version took 0.71 seconds. Which is a significant performance improvement of 3.47x.
When considering using threads to improve performance in Python, it’s important to know that they can introduce significant complexity to your code. Threads can cause issues related to synchronization, shared resources, and race conditions, which might lead to unpredictable behavior and hard-to-debug problems.
In Python, due to the Global Interpreter Lock (GIL), threads are only sometimes the most efficient way to achieve parallelism, especially for CPU-bound tasks. Instead, consider using other parallel programming techniques, such as multiprocessing or asyncio, which offer better performance gains and easier-to-manage code.
Using processes
This section looks at using multiple processes to improve Python application performance by leveraging multiple CPU cores.
The limitations of multithreading include increased bug potential and poor handling of CPU-intensive tasks as they only use one CPU core. Processes offer more isolation, stability, and bypass the Global Interpreter Lock (GIL) than threads.
However, processes have higher memory overhead and require careful balancing with CPU cores and resource sharing. The multiprocessing module in Python helps create and manage processes with a similar API to the Threads class.
We have changed the example of the thread to use multiple processes instead. The example uses multiple processes to download the images concurrently, which should improve performance compared to the sequential download.
def download_image(image_url, save_as):
    print(f"Downloading {image_url}...")
    urllib.request.urlretrieve(image_url, save_as)
    print(f"Downloaded {image_url} as {save_as}.")

def main():
    base = "https://commons.wikimedia.org/wiki/Special:NewFiles#/media/File:"
    image_urls = [
        base + "Christopher_Street_Day_Berlin_2019_510.jpg",
        base + "CSD_Frankfurt_Slubice_2021_029.jpg",
        base + "21.04.2023_MUC-Stammtisch-Erkundung_18.jpg",
        base + "SAZANKA_STREET_(52478707745).jpg",
    ]

    start_time = time.time()

    for i, image_url in enumerate(image_urls):
        download_image(image_url, f"image{i+1}.jpg")

    sequential_time = time.time() - start_time
    print(f"\nSequential download time: {sequential_time:.2f} seconds\n")

    start_time = time.time()

    processes = []

    for i, image_url in enumerate(image_urls):
        process = multiprocessing.Process(target=download_image,
                                          args=(image_url,
                                                f"image_processed{i+1}.jpg"))
        processes.append(process)
        process.start()

    for process in processes:
        process.join()

    multiprocessed_time = time.time() - start_time
    print(f"\nMultiprocess download time: {multiprocessed_time:.2f} seconds\n")

    print(f"Perf impr process: {sequential_time/multiprocessed_time:.2f}x")

if __name__ == "__main__":
    multiprocessing.freeze_support()
    main()
On my machine and my internet connection, the sequential download took 2.73 seconds, while the multi-process version took 0.74 seconds. Which is a significant performance improvement of 3.67x.
Using multiple processes improves performance for CPU-intensive applications but also introduces challenges in communication and coordination.
These challenges include handling exceptions and errors, synchronizing processes to manage shared resource access, ensuring the main process waits for all child processes to complete, and balancing workloads to prevent performance issues caused by uneven task distribution.
As we conclude this last section of the article on threads and processes, we have reached the end of our exploration. In the following summary, we will recap the main points and provide an overall understanding of the content discussed.
Conclusion
Optimizing Python code performance is crucial for creating efficient and scalable applications. Throughout this article, we have discussed several techniques and strategies to improve code performance, including profiling and benchmarking tools, comparing the efficiency of different coding styles, and using threads and processes for parallelization.
Profiling and benchmarking are essential steps in identifying performance bottlenecks and measuring the impact of optimizations. We explored various tools, such as timeit, cProfile, and memory-profiler, to measure execution time, identify slow functions, and analyze memory usage.
We compared the performance of different coding styles and techniques, including for-loops vs. list comprehensions, string concatenation methods, LBYL vs. EAFP, and generators vs. list comprehensions. Understanding the trade-offs and using the most suitable approach for the problem is important.
Lastly, we discussed using threads and processes to improve Python application performance. Threads can provide significant performance improvements for I/O-bound tasks, while processes are better suited for CPU-intensive tasks due to their ability to bypass the Global Interpreter Lock (GIL). Both approaches have challenges like synchronization, shared resources, and balancing workloads.
Optimizing Python code performance involves choosing the right coding techniques, employing suitable parallelization strategies, and continuously profiling and benchmarking the code to measure improvements.
With the knowledge and tools presented in this article, you are now well-equipped to analyze, optimize, and enhance the performance of your Python applications.
All the source code for the examples presented can be found in a dedicated GitHub repository. This repository also includes a GitHub Action for building, testing, and verifying the Python code to ensure its quality and effectiveness.