Practical Machine Learning Basics
My first exploration of Machine learning using the Titanic competition on Kaggle

This article describes my attempt at the Titanic Machine Learning competition on Kaggle. I have been trying to study Machine Learning but never got as far as being able to solve real-world problems. But after I read two newly released books about practical AI, I was confident enough to enter the Titanic competition.
The first part of the article describes preparing the data. The second part shows how I used a Support Vector Machine (SVM). I used the SVM to create a model that predicts the survival of the passengers of the Titanic.
The model resulted in a score of 0.779907, which got me in the top 28% of the competition. I am very happy with the result. You can find a Jupiter notebook with the solution and documentation in Github.
Introduction
Previously, I have tried to learn AI by reading books and, entering online courses. I never got very far. Most of these books and online courses were too theoretical.
In the last couple of months, I again tried wrapping my head around Machine Learning and AI. The reason was that I ordered two new books about Machine and Deep learning. These books included much practical knowledge and examples.
I saw a tweet that mentioned the book “Deep Learning for Coders with fastai and PyTorch: AI Applications Without a PhD”. The title got my attention as it targets programmers explicitly. Another book recommended to me was “Hands-on Machine Learning with Scikit-Learn, Keras, and TensorFlow.”

Deep Learning for Coders with fastai & PyTorch
This book is different from the past Machine Learning books I read. Directly from the start, it shows real practical code examples of deep learning. As I am a programmer, source code helps me to grasp the concepts.
The two authors also offer video lectures with the same content as the book. These video lectures are free. Besides this, there’s a forum for asking questions and discussions.
Hands-on Machine Learning with Scikit-Learn, Keras, and TensorFlow
This is also a practical book. It shows many practical examples. The book uses machine learning strategies such as Scikit-Learn, Keras, and Tensorflow. Many people use this book to prepare for the TensorFlow Developer Certification.
I walked through various examples in both books. This was fun and informative. But for me, the real challenge was to see if I could solve a real problem on my own from start to finish.
Both books mention Kaggle as a source for interesting data sets and machine learning problems.
Kaggle
Kaggle is an online community of data scientists and machine learning practitioners. Kaggle is a subsidiary of Google.
Kaggle allows you to search and publish data sets, explore, and build models. You can do this in a web-based environment. Kaggle also offers machine learning competitions with real problems and provides prizes to the winners of the game.
Now, how cool would it be if I could join a competition and be able to create a submission using my current Machine Learning knowledge?
There is a competition on Kaggle called “Titanic: Machine Learning from Disaster.” This is a competition that helps users familiarize themselves with how the Kaggle platform works.
This sounded to me as the perfect competition for me to start and experiment with Machine Learning.
Titanic: Machine Learning from Disaster

The Titanic sank on April 15, 1912, during her first voyage after hitting an iceberg. More than 1500 passengers of the 2224 passengers on board died as a result. While there was some element of luck involved in surviving, it seems some groups of people were more likely to survive than others.
The goal of the Titanic competition is to create a module that can predict which passengers survived the disaster.
The competition provides two data sets. A training set with passenger data such as name, age, gender, status, and if the passenger survived or not.
The second set contains the same data but without the survival sign. You have to return this second test set to Kaggle, with your prediction if the passenger survived or not.
One of the first questions we have to answer before building a Machine Learning model is what type of Machine Learning we are going to use?
What type of Machine Learning to use?
I don’t know yet how to answer this question. Even so, I know that we first need to determine if it is a regression or classification problem. This helps us to select an appropriate Machine Learning method.
A classification model attempts to predict from a set of discrete possibilities. A regression model attempts to state one or more numeric quantities.
We need to predict if a passenger survived or not. This sounds to me as a classification problem. So we need a Machine Learning type that can create such a classification model.
Now, I don’t know enough to choose the best machine learning strategy for this problem. But I do know how to build a classification model — for example, using Logistic Regression or Support Vector Machines.
I decided to use a Support Vector Machine (SVM).
Preparing the training data for Machine Learning
When reading both books and the Kaggle forums, I learned that before you can create a Machine Learning model, you have to prepare the data set. To prepare the data, I followed the following five steps.
- Load the data
- Convert text values to numbers
- Select relevant parameters using the correlation
- Remove or fill missing values
- Remove outliers
1. Loading the Titanic passenger data
To load and manipulate the data, I use the pandas library. Pandas offer data structures and operations for controlling numerical tables and time series.
I downloaded train.csv and test.csv from Kaggle and stored them in a folder datasets. Pandas offer convenient methods to read CSV files.
When you execute this Python script, it loads the data and shows the first five lines of the training data set.
Below the description of each field is given as given by Kaggle.
2. Convert text to numbers
To be able to use the fields in a Machine Learning strategy, we must convert them to a number. Also to be able to calculate the correlation between the fields, the fields must be numeric.
The values in the columns should be numerical to be able to calculate the correlation. Besides this, most Machine Learning algorithms prefer to work with numbers. So, we need to convert the Sex and Embarked column to a number.
The library Scikit-Learn contains a class calledOrdinalEncoder which can be used for this purpose. The code below shows how to convert the Sex column to a number.
In the same way, I also converted the Embarked column to a number.
3. Select relevant parameters via the correlation
Before I start removing records or adding missing values, I want to know which values are most likely to influence passengers’ survival. Some fields may be obvious such as the Sex column. Because of the “Women and children first” code of conduct, the Sex column is a good indicator of the survival chances of a passenger.
But I wanted to have a more strategic way to determine this. You can calculate the correlation between the Survived column and the other columns using the data frame’s corr() method.
This results in the following correlation matrix.
We see that the Sexenc column, as expected, has the strongest correlation with Survived. The columnsPclass, Fare, Embarkedenc also have a decent correlation. The correlation between the rest of the columns is minimal. So, I removed these columns from the training set as they have no or minimal impact on the Machine Learning model.
Columns can be removed easily with the drop method on the data frame.
4. Remove or add missing values
With the data loaded we can investigate if there is data missing in the training set. With the method read_csv we created a data frame called titanic.
This data frame has a method called isna() that creates a two-dimensional array of the same size as the data frame. The array is filled with boolean values that indicate if the value from the original data frame is not available (an). By combining the isna with sum, titanic.isna().sum() we get a nice overview that indicates how many missing values there are in the data frame.
We see that 177 records are missing from the Age column, 687 records are missing from the Cabin column, and two from Embarked. There are several possibilities to add missing values. You can remove the records that have the missing values. You can also add the missing values. For example, with Age, you could calculate the mean or median and add it to the missing values.
You can evaluate what performs best when you look at the results of the Machine Learning prediction.
I decided to start by filling the missing Age values with the mean.
I decided to fill the two missing values from Embarked with the most common value. With the line titanic[‘Embarked’].value_counts(), you get an overview of the values inside the column. This command resulted in the following output.S 644
C 168
Q 77
We see that S (Southhampton) is the most common value. So we can fill the missing two values using the fillna method.
titanic[“Embarked”] = titanic[“Embarked”].fillna(‘S’)
Cabin column
Although many values are missing in the Cabin column, you can still extract relevant information from it. The first letter of the Cabin numbers such as B96, G6, C23, E101 indicates the Cabin’s deck.
The deck seems to me as important information as passengers on lower decks may have a lower chance of survival.
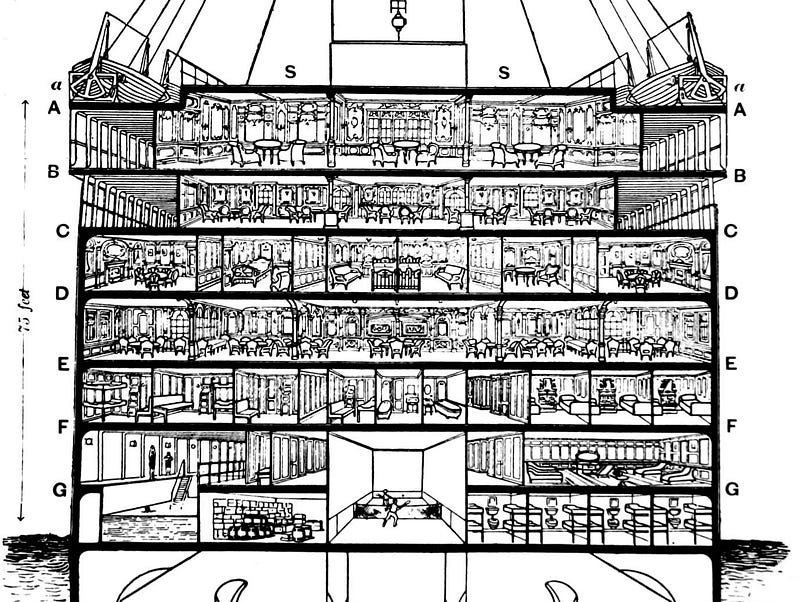
We can create a new column named Deck using the following statement titanic[‘Deck’] = titanic[‘Cabin’].str[:1]. Note that we also have to convert this column to a number as we saw before.
The introduction of a new feature in the data by using domain knowledge is called Feature engineering.
5. Remove outliers
The last step in our data preparation is identifying and removing outliers. Outliers are extreme values that are outside what is expected and unlike the rest of the data. Often machine learning models can be improved by removing these outlier values.
There are multiple ways to detect and remove outliers. I use the quantile method to detect and remove the values that are higher than 99% or lower than 1% of the data.
You have to be careful with removing the outliers as you don’t know for sure that these values are indeed wrong. I try to build the machine learning model with and without the outliers and see if the model’s performance improves or deteriorates.
With the data cleaned, outliers removed, and filling the missing values we can finally start with training the Machine Learning model.
Creating and training the Support Vector Machine (SVM)
As stated before I choose an SVM for the Machine Learning strategy. The Scikit-Learn library contains an implementation of an SVM.
We need to do one more thing before feeding the data to the SVM, feature scaling. Most Machine Learning algorithms don’t perform well when the numerical input features have different scales. This is the case with the Titanic data.
We scale the data using the scale() function of Scikit-Learn. Scale is a quick and easy way to scale the values in such a way that all features are centered around zero and have variance in the same order.
Another thing I did is to split the training set into a training set and test set on row three. This allows us to validate the performance of the trained model using the test set.
In row seven, we create the SVM called SVC in Scikit-Learn. The actual training of the model is performed using the fit method in row eight.
To evaluate the model’s performance, we create a confusion matrix using the plot_confusion_matrix function from Scikit-Learn. The confusion matrix function uses the test set to visualize the performance.

This matrix indicates that the model predicted the survival of 123 passengers correctly (yellow). Also, the model predicted correctly for 62 passengers that they did not survive (teal). On the other hand, the model incorrectly predicted that 27 passengers Survived while they did not (blue). Also, it incorrectly predicted that 11 passengers did not survive while they actually did survive (purple).
So our model works but is not perfect.
Predicting the survival of the test set and submitting it to Kaggle
The last part of the competition is to use the trained model to predict the survival of the passengers using the test set from Kaggle. As with the training set, the test set also needs to be cleaned.
Because I created functions for loading and cleaning the data, this is as easy as calling the functions with the test set.
In row seven, the previously trained SVM is used to predict the survival of the passengers in the test set. The rest of the code is to transform the result into a format that can be used to submit to Kaggle.

The full Jupiter notebook can be found here in Github.
Conclusion
The Deep Learning for Coders and the Hands-on Machine Learning book practically explains Machine Learning. They contain many examples that show how to solve real-world Machine Learning problems.
The most significant part of solving a problem using Machine Learning is preparing the data so that a Machine Learning Algorithm can use it. I looked at the correlation between the fields in the data set to see which fields to keep. The median of the values replaced the missing values. We translated the none numerical fields to numbers to be able to use them in Machine Learning.
With both books’ help, I entered the Kaggle Titanic competition and got a score of 0.779907. I will continue studying both books and try to improve my score.
The next Kaggle competition I will be joining is the Digit Recognizer. This uses the MNIST (“Modified National Institute of Standards and Technology”) data set. This is the de facto “hello world” dataset of computer vision.
Thank you for reading.