Getting Started With Falco
How to secure your Kubernetes clusters

Imagine this scenario: Your team handles a Kubernetes cluster supporting your organization’s vital workloads.
Suddenly, you observe a dramatic increase in traffic to your applications, and your monitoring tools send alerts on the high volume. As your heart pounds, you recognize that your infrastructure might be under attack, jeopardizing the safety of your applications and data.
So, what’s your next move? Will you stand by, anticipating the worst, or will you take proactive measures to safeguard your cluster?
Our company recently faced a comparable situation. We detected an unexpected surge in traffic targeting our applications hosted on our Kubernetes cluster, and our monitoring tools issued alerts.
We knew that swift action was crucial to avoid a potential breach.
Our investigation exposed a container within one of our pods still operating as root. A developer initiated a NodePort to test the container but neglected to close it afterward.
Upon identifying the issue, we closed the NodePort and replaced the container image with a version that did not run as root.
This experience highlighted the limitations of manual monitoring and investigation, emphasizing the need for a more viable solution.
That’s when we came across Falco — an open-source runtime security tool designed to detect and prevent real-time attacks on containers, Kubernetes, and cloud services.
In this article, I will walk you through the steps we followed to install Falco, covering everything from installation and configuration to devising custom rules and alerts.
What is Falco?
Falco is like having a security guard for your Kubernetes clusters, but instead of just watching for intruders, this guard can detect and prevent all sorts of security threats in real time.
It’s important to note that Falco is not a security silver bullet that can prevent all threats.
Instead, it acts as a vigilant guard, constantly monitoring your Kubernetes clusters and alerting you to any suspicious activity in real-time.
For example, in the situation described in the introduction, Falco would not prevent a developer from starting a container that runs as root or creating a service with the type NodePort.
However, by creating custom rules specifically targeting these actions, Falco can immediately alert you when they occur, allowing you to take immediate action to mitigate any potential security risks.
Falco Architecture
At a high level, the architecture of Falco can be broken down into three main parts: events, filtering and alerting.
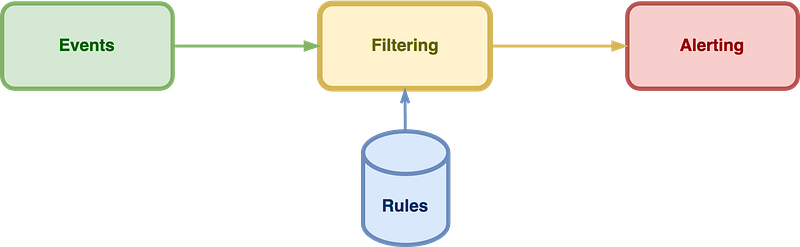
First, Falco can collect events from various sources in your Kubernetes clusters, including system calls, network traffic, and container activity.
These events are filtered through a customizable set of rules defining a potential security threat.
Finally, when a rule is triggered, Falco generates an alert, which can be sent to various destinations, such as a Slack channel, an email address, or a webhook.
The beauty of Falco lies not only in its flexible architecture but also in its vibrant community of contributors and users.
On the event generation side, a constant stream of new event sources is being added to Falco, expanding its ability to monitor and detect potential threats in Kubernetes clusters.
Meanwhile, on the alerting side, users are experimenting with new and creative ways to receive alerts, such as integrating Falco with chat applications, ticketing systems, and more.
Installing Default Falco in Kubernetes
When installing Falco, several options are available depending on your environment. In our case, we decided to install Falco as a daemonset. This ensures that it gets deployed on all nodes in our Kubernetes cluster.
One of the easiest ways to install Falco in Kubernetes is by using Helm. The Falco community provides an official helm chart to install and configure Falco. You can install Falco using the following four steps.
- First, you need to have Helm installed on your local machine. If you haven’t installed it yet, you can follow the instructions on the official Helm website.
- Next, add the Falco Helm repository to your local Helm installation by running the following commands:
helm repo add falcosecurity https://falcosecurity.github.io/charts
helm repo update
3. Now you can install Falco using Helm by running the following command:
helm install falco --set tty=true falcosecurity/falco --namespace falco --create-namespaceI added the --set tty=true flag to the Falco configuration to prevent Falco from buffering logs. With this option enabled, alerts will be immediately shown in the log as soon as they are triggered.
4. Falco instances should run on all your nodes after a few minutes. The status of Falco pods can be inspected through kubectl:
kubectl get pods -n falco -o wideSuppose the installation process is completed without any issues. In that case, you should see an output similar to the following, which indicates that all Falco instances are up and running in your cluster. The number of Falco pods running will depend on the number of nodes in your cluster configuration, with one pod for each node.
NAME         READY   STATUS   RESTARTS AGE     IP          NODE
falco-57w7   2/2     Running  0        3m12s   10.244.0.1   control-plane
falco-h459   2/2     Running  0        3m12s   10.244.1.2   worker-node-1
falco-kb55   2/2     Running  0        3m12s   10.244.2.3   worker-node-2
We currently have three Falco pods running with the default configuration. They are configured to monitor system calls and trigger alerts based on the default Falco rules. These alerts are sent to the standard output.
To view the alerts triggered by Falco, you can access the logs of a Falco pod using the following command.
k logs falco-57w7 -n falcoSuppose you create a terminal session in an existing pod. In that case, Falco will trigger an alert. See the last line of the log below.
Defaulted container "falco" out of: falco, falcoctl-artifact-follow, falco-driver-loader (init), falcoctl-artifact-install (init)
Thu Mar 16 13:30:35 2023: Falco version: 0.34.1 (x86_64)
Thu Mar 16 13:30:35 2023: Falco initialized with configuration file: /etc/falco/falco.yaml
Thu Mar 16 13:30:35 2023: Loading rules from file /etc/falco/falco_rules.yaml
Thu Mar 16 13:30:36 2023: The chosen syscall buffer dimension is: 8388608 bytes (8 MBs)
Thu Mar 16 13:30:36 2023: Starting health webserver with threadiness 2, listening on port 8765
Thu Mar 16 13:30:36 2023: Enabled event sources: syscall
Thu Mar 16 13:30:36 2023: Opening capture with Kernel module
13:35:15.689918401: Notice A shell was spawned in a container with an attached terminal (user=root user_loginuid=-1 k8s.ns=default k8s.pod=test container=f7a3a145960b shell=sh parent=runc cmdline=sh pid=71892 terminal=34816 container_id=f7a3a145960b image=docker.io/library/nginx)
Although the system is now functional, it can not yet prevent the scenario described in the introduction. To achieve this, three additional steps are necessary.
First, we must integrate the Kubernetes plugin, allowing Falco to monitor Kubernetes events and system calls.
Second, we must create custom rules identifying when a NodePort service is opened and when a container image running as root is used.
Lastly, we need to set up an effective alerting mechanism to notify us when these events occur.
Adding the Kubernetes plugin to Falco
The built-in Falco k8saudit plugin manages the event source and field extraction capabilities within the Falco Plugin System.
Installing the plugin
To install the plugin, we need to modify the Helm installation process and provide it with additional parameters. We can start by uninstalling Falco using the following command. This will allow us to reinstall Falco with the necessary parameters to enable the plugin.
helm uninstall falco --namespace falcoNext, we can reinstall Falco with the desired configuration using a custom values.yaml file. The file contains the Falco settings that you want to override during installation. This can be achieved by passing the file as an argument during the Helm installation process for Falco.
The custom values.yaml we will use can be found in the Falco Github repository. This yaml file contains the k8saudit definition in the plugins section, as seen below.
plugins:
    - name: k8saudit
      library_path: libk8saudit.so
      init_config:
        ""
        # maxEventBytes: 1048576
        # sslCertificate: /etc/falco/falco.pem
      open_params: "http://:9765/k8s-audit"
    - name: json
      library_path: libjson.so
      init_config: ""
  load_plugins: [k8saudit, json]
To reinstall Falco using this yaml file, save the yaml from the GitHub repository as values-syscall-k8saudit.yaml and execute the following command.
helm install falco falcosecurity/falco --namespace falco -f ./values-syscall-k8saudit.yaml --create-namespaceConfiguring Kubernetes to send audit logs to Falco
To enable Kubernetes audit logs to be sent to Falco, we need to reconfigure the Kubernetes API server to forward audit events.
The process of reconfiguring Kubernetes depends on the type of cluster you’re using. For example, if you’re using a managed Kubernetes service like Amazon Elastic Kubernetes Service (EKS) or Azure Kubernetes Service (AKS), the steps to reconfigure the cluster may differ from an on-premise Kubeadm cluster.
We are going to use a standard Kubeadm cluster as an example.
A Kubernetes cluster is constantly buzzing with activity, making it infeasible and impractical to record everything.
By implementing an audit policy, you can selectively filter and record only the events of interest. To prioritize security, we will create a policy explicitly targeting requests associated with pods, kube-proxy, secrets, configurations, and other essential components. See below the policy that we will be using.
Save the YAML content below as a file named policy.yaml in the /etc/kubernetes/audit/ directory. This file will be referenced in the API server configuration later on.
apiVersion: audit.k8s.io/v1
kind: Policy
rules:
  # Metadata level - Log metadata only, excluding request and response bodies
  - level: Metadata
    resources:
      - group: "" # core API group
        resources: ["pods", "services", "configmaps", "endpoints", "persistentvolumeclaims", "persistentvolumes", "nodes", "events", "secrets", "serviceaccounts", "replicationcontrollers"]
      # ... include other resource groups as needed
    users: ["*"]
    verbs: ["create", "update", "patch", "delete"]
    omitStages:
      - "RequestReceived"

  # Request level - Log request metadata and spec, excluding status and response
  - level: Request
    resources:
      - group: "" # core API group
        resources: ["pods", "services", "configmaps", "endpoints", "persistentvolumeclaims", "persistentvolumes", "nodes", "events", "secrets", "serviceaccounts", "replicationcontrollers"]
      # ... include other resource groups as needed
    users: ["*"]
    verbs: ["create", "update", "patch", "delete"]
    omitStages:
      - "RequestReceived"

  # ... include other rules as needed
As shown below, we need to create a webhook configuration file to forward the audit events to Falco’s webserver. This file will be referenced in the API server configuration. Make sure to replace the IP address with the cluster IP of the Falco service in your specific setup. You can obtain this IP address by running the command kubectl get svc -n falco.
apiVersion: v1
kind: Config
clusters:
- name: falco
  cluster:
    server: http://10.104.167.247:9765/k8s-audit
contexts:
- context:
    cluster: falco
    user: ""
  name: default-context
current-context: default-context
preferences: {}
users: []
The final steps involve adding the following arguments to the API server configuration. Since the API server is a pod, we also need to mount the audit folder within the pod.
- --audit-policy-file=/etc/kubernetes/audit/policy.yaml
- --audit-webhook-config-file=/etc/kubernetes/audit/webhook.yaml
- --audit-log-format=json
volumeMounts:
- mountPath: /etc/kubernetes/audit
name: auditvolumes:
- hostPath:
path: /etc/kubernetes/audit
type: DirectoryOrCreate
name: auditAdding additional Falco rules for Kubernetes
With everything set up, Falco alerts based on the Kubernetes audit events can now be observed in the Falco logs. To create an alert when someone creates a NodePort service, as mentioned in the introduction, we need to add the following rule to Falco.
- rule: Create NodePort Service
  desc: >
    Detect an attempt to start a service with a NodePort service type
  condition: kevt and service and kcreate and ka.req.service.type=NodePort
  output: NodePort Service Created (user=%ka.user.name service=%ka.target.name ns=%ka.target.namespace ports=%ka.req.service.ports)
  priority: WARNING
  source: k8s_audit
  tags: [k8s]
These custom rules should be formatted in a yaml file like the yaml file below.
customRules:
  custom_k8s_rules.yaml: |-
    # Like always_true/always_false, but works with k8s audit events
    - macro: k8s_audit_always_true
      condition: (jevt.rawtime exists)

    - macro: k8s_audit_never_true
      condition: (jevt.rawtime=0)

    # Generally only consider audit events once the response has completed
    - list: k8s_audit_stages
      items: ["ResponseComplete"]
The following command can add this rule file to the Helm Falco installation.
helm install falco falcosecurity/falco --namespace falco -f ./values-syscall-k8saudit.yaml -f ./custom_k8s_rules.yaml --create-namespaceAdd alerting
To enable alerts, we are going to use Falco Sidekick. Falco Sidekick is a tool that enhances Falco by forwarding its alerts to various destinations. To send Falco alerts to Slack using Falco Sidekick, follow these steps:
- Install Falco Sidekick: If you haven’t already installed Falco Sidekick, you can add it to your cluster using its Helm chart:
helm repo add falcosecurity https://falcosecurity.github.io/charts
helm repo update
helm install falcosidekick falcosecurity/falcosidekick --set webui.enabled=true
2. Configure a Slack Incoming Webhook:
- Go to the following URL: https://my.slack.com/services/new/incoming-webhook/
- Choose the Slack channel where you want to receive the alerts and click “Add Incoming WebHooks integration.”
- Copy the Webhook URL provided. You’ll need it for configuring Falco Sidekick.
3. Configure Falco Sidekick to send alerts to Slack:
- Update the Falco Sidekick configuration to enable the Slack output and provide the Slack webhook URL you got in step 2.
- You can do this by setting the
--setflag when installing or upgrading the Helm chart:
helm upgrade --install falco-sidekick falcosecurity/falco-sidekick --namespace falco --set config.slack.webhookurl="https://hooks.slack.com/services/your/webhook/id"4. Update Falco configuration to forward alerts to Falco Sidekick:
- Ensure Falco is configured to send its alerts to Falco Sidekick. Update the Falco configuration file (
falco.yaml) with the following:
json_output: true
json_include_output_property: true
http_output:
  enabled: true
url: "http://falco-sidekick.falco:2801"- Restart the Falco pods to apply the new configuration.
Troubleshooting
This chapter will focus on troubleshooting Falco when combined with Kubernetes. While integrating Falco with Kubernetes, we faced several challenges in getting all the components to work together seamlessly.
This chapter aims to guide overcoming such obstacles and help you achieve a smooth and functional setup.
Perform the following checks to make sure that your installation is configured correctly.
▹ — Verify Falco installation: Ensure that Falco is installed and running in your Kubernetes cluster. You can check the status of the Falco pods using kubectl get pods -n falco.
▹ — Audit policy configuration: Ensure a valid Kubernetes audit policy is configured. The audit policy defines what events should be recorded and at what level. Check the Kubernetes documentation for creating an audit policy: https://kubernetes.io/docs/tasks/debug-application-cluster/audit/#audit-policy
▹ — Enable the Kubernetes audit log: Ensure the Kubernetes API server has the required flags to enable the audit log. You’ll need to configure the following flags in the API server manifest (usually located at /etc/kubernetes/manifests/kube-apiserver.yaml):
--audit-policy-file=<path_to_audit_policy_file>
--audit-log-path=<path_to_audit_log_file>
--audit-log-format=json
--audit-webhook-config-file=<path_to_audit_webhook_config_file>
▹ — Create the webhook configuration file: Configure the webhook that will forward the audit events to Falco. Create a YAML file with the following content, replacing <falco_service> with the appropriate value (e.g., falco.falco.svc.cluster.local or ip address):
apiVersion: v1
kind: Config
clusters:
  - name: falco
    cluster:
      server: "http://<falco_service>:8765/k8s_audit"
contexts:
  - name: default-context
    context:
      cluster: falco
      namespace: default
current-context: default-context
▹ — Configure Falco to receive audit events: In the Falco configuration file (falco.yaml), enable the k8s_audit_endpoint by setting the value to /k8s_audit.
▹ — Configure Falco rules: Verify that Falco has the appropriate rules enabled to process the Kubernetes audit events. Check the Falco rules file (falco_rules.yaml) and make sure the relevant Kubernetes audit rules are enabled.
▹ — Check network connectivity: Ensure the Kubernetes API server can reach the Falco service over the network. You can test this by running a simple curl command from the API server to the Falco service:
curl -XPOST -d '{"kind": "Event", "apiVersion": "audit.k8s.io/v1", "metadata": {"creationTimestamp": null}, "level": "Metadata", "timestamp": "2023-03-19T15:02:11Z", "auditID": "test", "stage": "ResponseComplete", "requestURI": "/api/v1/namespaces/test/pods", "verb": "create", "user": {"username": "admin"}, "sourceIPs": ["127.0.0.1"], "objectRef": {"resource": "pods", "namespace": "test", "name": "test-pod", "apiVersion": "v1"}}' http://falco-k8saudit-webhook.falco.svc.cluster.local:8765/k8s_audit▹ — Check logs and events: Inspect the logs from the Kubernetes API server, Falco, and the Falco webhook receiver to identify any issues or errors. You can use kubectl logs <pod_name> -n falco to check the logs of Falco pods.
▹ — Test and verify: Perform actions in the Kubernetes cluster that should trigger your configured audit rules. Check the Falco logs and alerts to confirm that the events are being processed correctly.
We encountered an issue where there was a discrepancy between the webhook configuration and Falco’s listener. In the webhook configuration, we used k8s_audit, whereas Falco was listening on k8s-audit.
Conclusion
In this article, we’ve explored setting up and configuring Falco for Kubernetes security.
This ensures that oversights, such as neglecting to clean up a development pod, as mentioned in the introduction, are a thing of the past.
We’ve successfully deployed Falco in our production cluster, and thus far, the impact on performance has been minimal. We maintain optimal performance by continuously monitoring the system, refining existing rules, and introducing new ones.
Throughout this article, we’ve delved into installing, configuring, and creating custom rules, showcasing Falco’s powerful capabilities in enhancing Kubernetes clusters’ security posture.
Users can effectively monitor their infrastructure and receive real-time alerts on critical security events by utilizing Falco with its Sidekick and integrating it with popular tools like Slack.
The insights provided in this article help users safeguard their Kubernetes environments and inspire them to explore Falco’s potential further, ultimately leading to a more secure and robust container orchestration ecosystem.