Cracking the Code — A Guide to Python Debugging Tools
Master the art of troubleshooting in Python with essential debugging tools

In a bustling tech startup, where innovation thrived, and dreams transformed into reality, a young Python software engineer named Jake worked. Fresh out of college, Jake was eager, quick, and full of potential. His code was like poetry, or so he believed.
One day, Jake was working on a complex piece of software. Somewhere in the intricate weave of his Python code, a nasty bug had taken house, a bug that Jake had introduced. Despite his best efforts, the bug remained elusive, disrupting the flow of his program.
Desperate to squash this bug, Jake resorted to the age-old technique every programmer knows — the print statement. He peppered his code with print statements, hoping to catch the bug red-handed. Print statements bloomed like wildflowers in his code — they were everywhere. But alas, the bug remained unfazed, continuing its reign of chaos.
When Jake was on the verge of giving up, Suzy, an experienced developer known for her wisdom and patience, passed by his desk, she noticed the frustration etched on Jake’s face and the jungle of print statements on his screen.
With a knowing smile, she asked, “Chasing a bug, Jake?”
Jake nodded, explaining the issue. Suzy listened, her eyes twinkling with a touch of amusement. She said, “Print statements are handy, but have you tried using pdb, Jake? It’s a built-in Python debugger, quite a powerful tool, you know.”
Intrigued, Jake followed Suzy’s advice. She guided him through the process. She showed him how to set breakpoints, inspect variables, and control program execution. And like a seasoned detective, pdb helped Jake uncover the hidden bug. He solved the mystery that had consumed his entire day.
The joy of victory swept over Jake. He’d conquered the bug and discovered a far more effective way to debug his Python code. From that day forward, pdb became his go-to tool whenever a bug dared to infiltrate his code.
In this article, we’re setting out on an expedition through the landscape of Python debugging tools.
It’s a journey that will take us from the built-in Python debugger (pdb), through the enhanced capabilities of pdb++ and ipdb, to the visual delights of PuDB and popular IDEs like PyCharm and Visual Studio Code.
Table of contents
· The Built-in Python Debugger (pdb)
· Enhanced Python Debuggers
∘ pdb++
∘ IPython Debugger (ipdb)
· Visual Debuggers
∘ PuDB: A Debugger with Visual Flair
∘ Debugging with Visual Studio
∘ Debugging with PyCharm
· pdb-clone, a debugging tool for special cases
∘ How does pdb-clone work?
∘ Installing pdb-clone
∘ Using pdb-clone
· Comparing Python Debugging Tools: Pros, Cons, and Use Cases
· Conclusion
The Built-in Python Debugger (pdb)
The Python Debugger, or pdb, is a built-in module in Python that allows developers to interactively explore the state of their programs, inspect variables, and understand the flow of their programs.
Using pdb, you can set breakpoints, step through your code, evaluate expressions, and even change variable values — all at runtime. This tool is shipped with Python, so installing anything extra is unnecessary.
There are several reasons why you should consider using pdb:
- Understanding Code Flow: pdb lets you step through your code line by line. This is extremely useful when understanding a complex function or method or reading someone else’s code.
- Inspecting Variables: With pdb, you can print the values of variables at any point in your program. This is particularly helpful when a function isn’t returning what you expect or a variable isn’t being set correctly.
- Interactive Debugging: pdb is an interactive debugger. This means you can change variable values, execute new lines of code, and even define new functions and methods, all while your program is paused.
Some of the basic pdb commands you should know are:
- l (list): This command displays 11 lines around the current line or continues the previous listing.
- s (step): Executes the current line and stops at the first possible occasion.
- n (next): Continues execution until the next line in the current function is reached.
- b (break): Sets a breakpoint at the provided line number.
- c (continue): Continues execution and only stops when a breakpoint is encountered.
- p (print): Evaluates the expression in the current context and prints its value.
- q (quit): Quits the debugger and exits.
These commands form the backbone of pdb and are powerful tools in your debugging arsenal. Let's demonstrate pdb using a Python application.
def add_numbers(a, b):
    result = a + b
    return result

def main():
    num1 = 5
    num2 = '10'  # This should be an integer, not a string
    result = add_numbers(num1, num2)
    print(f"The sum of {num1} and {num2} is {result}")

if __name__ == "__main__":
    main()
This script has a bug because we’re trying to add an integer (num1) to a string (num2).
Let’s see how we can use pdb to find this bug. First, we need to set a breakpoint where we want our program to pause. We call pdb.set_trace() or breakpoint(). For this example, let's put the breakpoint at the start of the add_numbers function:
import pdb

def add_numbers(a, b):
    breakpoint()
    result = a + b
    return result

# Rest of the code...
When we run our script, it will pause before executing the line result = a + b. We can inspect variables a and b by typing p a and p b in the console. We'll see that a is an integer and b is a string, which reveals our bug!
From here, we could continue execution with the c command, step to the next line with n, or quit the debugger with q.
The bug might not be this obvious in a real-world situation, and you may need to step through more of your code to find the issue. But this example gives a basic idea of how pdb works.
Since pdb is part of the Python standard library, it is available wherever Python is installed. This makes it particularly useful when installing additional software, such as restricted servers, Docker containers, or other isolated environments, is difficult or impossible.
For example, when working with a remote server via SSH, you can easily use pdb to debug your Python scripts. You can set breakpoints in your code, run the script, and the pdb debugger will pause execution at the breakpoints, allowing you to inspect variables, step through your code, and identify issues.
This kind of remote debugging can be invaluable when dealing with issues that only occur in specific environments, like production servers.
Enhanced Python Debuggers
Let’s delve into pdb++ and ipdb, two powerful extensions built upon the standard pdb debugger. Unlike pdb, which comes bundled with Python, these tools require an additional installation step.
However, their enhanced features might be worth this extra effort. We’ll kick things off with pdb++, then switch gears to explore ipdb. Remember, pdb’s ubiquity was its key advantage. Now let’s see what these extensions have to offer.
pdb++
pdb++ is an extension of pdb, the built-in Python debugger that provides additional features and enhancements to make your debugging experience more interactive and productive. It’s a drop-in replacement for pdb and is fully compatible with its commands and functionality. Here are some of the key features and benefits of pdb++:
- Sticky Mode: This is one of the most notable features of pdb++. In sticky mode, the source code surrounding the current position is continuously displayed while you step through your code. This can significantly improve the standard pdb interface, which only shows a single line of code at a time.
- Syntax Highlighting: pdb++ supports syntax highlighting, which makes it easier to read and understand the code you’re debugging. Syntax highlighting can be especially helpful during long debugging sessions.
- Tab Completion: pdb++ features tab completion for Python identifiers and pdb commands. This can save you time and avoid typos when typing variable names or commands.
- Improved pdb Commands: pdb++ enhances several existing pdb commands. For example, the args command in pdb++ shows the arguments of the current function and its values.
- Additional Commands: pdb++ introduces several new commands unavailable in pdb. For example, the ll command lists the whole function or method around the current line.
- Exception Catching: pdb++ automatically enters post-mortem debugging if an exception is uncaught, which can be very useful for understanding what led to the exception.
To install pdb++, use the command pip install pdbpp. Once you've got it installed, let's use it to debug our example below.
import pdb

def buggy_function(n):
    result = 0
    for i in range(n):
        pdb.set_trace()  # set a breakpoint here
        result += i/i
    return result

buggy_function(10)
You'll notice that pdb++ supports syntax highlighting straightaway, instantly making your debugging sessions more visually appealing and readable.
The pdb++ commands are the same as pdb’s, so you can use n to go to the following line, l to list the source code, p to print the value of variables, and q to quit the debugger. But with pdb++, you also get a few new commands, such as ll (longlist), which show more lines of code than the l command.

In conclusion, pdb++ enhances the built-in Python debugger with additional features that can make debugging more efficient and less cumbersome. However, like pdb, it’s still a command-line tool, which might not be as approachable for developers using graphical debuggers.
IPython Debugger (ipdb)
IPython Debugger or ipdb is another powerful tool for Python debugging. It’s essentially an integration of the pdb debugger with the highly interactive IPython shell. This integration gives you the best of both worlds: you get the robust debugging features of pdb and the versatility and convenience of the IPython shell.
Why use ipdb?
Here are a few reasons why you might want to use ipdb:
- Tab Completion: One of the key advantages of ipdb is its support for tab completion. This feature can save you considerable time and effort when writing commands during debugging sessions.
- Syntax Highlighting: Like pdb++, ipdb also supports syntax highlighting, making your debugging experience more visually pleasing and code readable.
- Access to IPython Magic Commands: ipdb provides access to IPython’s ‘magic’ commands — special commands that offer a quick way to perform common tasks. This can significantly speed up your debugging workflow.
Key Features of ipdb:
- Breakpoints: You can set breakpoints in your code where execution will pause, allowing you to inspect the current state of your program.
- Stepping Through Code: ipdb allows you to step through your code line by line, watching how the state of your program changes as it executes.
- Inspecting Variables: You can inspect the value of variables at any point in your code to see what’s happening inside your program.
How to use ipdb:
To start using ipdb, you first need to install it with pip: pip install ipdb. Once installed, you can import it into your code and similarly set a trace to pdb:
import ipdb
ipdb.set_trace()
This will start the ipdb debugger at that point in your code, and you can use the various commands to navigate and inspect your program.
Remember, the power of ipdb lies in the combination of robust pdb debugging features and the dynamic interactive environment of IPython.
Visual Debuggers
As we move forward, we’ll be focusing on visual debugging tools. First up is PuDB, a versatile debugger designed directly in your console or terminal. After exploring PuDB, we’ll switch gears and delve into the world of Integrated Development Environments (IDEs), specifically Visual Studio Code and PyCharm, and examine how these powerful tools handle debugging.
PuDB: A Debugger with Visual Flair
Imagine if you could take all the powerful debugging features we’ve been discussing and wrap them up in a slick, console-based interface. Sounds neat, right? Well, that’s precisely what PuDB is all about!
PuDB is a visual debugger for Python. It provides all the functionality you’ve expected from a debugger — breakpoints, stepping through code, inspecting variables — but presents everything in an interactive, full-screen, text-based interface.
It’s like having a debugger and a code editor rolled into one. And because it runs in the console, you can use it over SSH or in a terminal session, which can be a real lifesaver when dealing with remote servers.
Installing PuDB:
Getting PuDB up and running is a cinch. Just fire up your terminal and type: pip install pudb
That’s it! You’re ready to start debugging with PuDB.
Using PuDB:
Let’s say we’ve got a bit of code that’s acting up. Maybe it’s the same code snippet we’ve been using in our previous examples:
def mystery_function(n):
    result = 0
    for i in range(n):
        result += i / (50 - i)
    return result

print(mystery_function(40))
We’ve got a sneaky ZeroDivisionError in there. How do we hunt it down with PuDB?
First, we import PuDB and set a breakpoint by calling pudb.set_trace(). This will pause the execution of our program at that point and fire up the PuDB interface.import pudbdef mystery_function(n):
result = 0
for i in range(n):
pudb.set_trace() # Setting breakpoint here
result += i / (50 - i)
return resultprint(mystery_function(40))
We’ll be greeted with the PuDB interface when we run our script. We can step through our code, line by line, with the n (next) and s (step) commands, just like in pdb. We can inspect variables, set additional breakpoints, and even change the value of variables on the fly.

And the best part? It’s all presented in a clear, visual interface. We can see our code, the call stack, and the values of variables all at a glance. No more squinting at a wall of text!
That’s PuDB in a nutshell. It’s a powerful, versatile tool that’s a pleasure to use. Try it next time you find yourself wrestling with a tricky bug.
Debugging with Visual Studio
Visual Studio Code (VS Code) is a versatile code editor boasting various features, including a powerful debugging experience. Unlike pdb, pdb++, or PuDB, VS Code is not just a debugger but an Integrated Development Environment (IDE) with features to improve your coding workflow. Here are some key features of its debugger:
- Visual Debugging: VS Code offers an interactive interface for debugging needs. You can set breakpoints, step through your code, inspect variables, and view the call stack. This visual feedback can make understanding what’s happening in your code easier.
- Languages Support: VS Code supports debugging for multiple languages, including Python, out of the box. This support is often extended by installing the appropriate extension for your language. For Python, the Microsoft Python extension is highly recommended.
- Launch Configurations: You can customize how VS Code launches your program and initiates debugging through .json configuration files. You can create different configurations for tasks, like debugging tests versus the application itself.
- Debug Console: VS Code has a built-in debug console that provides a REPL during debugging sessions. This console lets you execute arbitrary Python code in the context of the process being debugged, allowing for powerful interactive exploration.
- Extensions: The functionality of VS Code can be further extended with various extensions. For example, the Python Test Explorer extension allows running and debugging unit tests directly in the editor.
How to use the debugger in VS Code
Before you can start debugging Python code with VS Code, you must install the Python extension from Microsoft. You can install this extension directly from the Extensions view in VS Code.
Once installed, here’s a simple way to start debugging:
- Open the Python file you want to debug.
- Click the Debug icon in the left-hand Activity Bar to switch to the Debug view.
- Set a breakpoint in your code by clicking just to the left of the line numbers in the editor or by placing the cursor on a line and pressing F9.
- Press F5 to start debugging.
VS Code will then start your program and pause execution at the first breakpoint it encounters. You can now step through your code, inspect variables, and use the Debug Console to execute Python code in the context of your running program.

Remember, the power of VS Code’s debugger comes from its versatility and the additional features provided by extensions. Be sure to explore these to enhance your Python debugging experience.
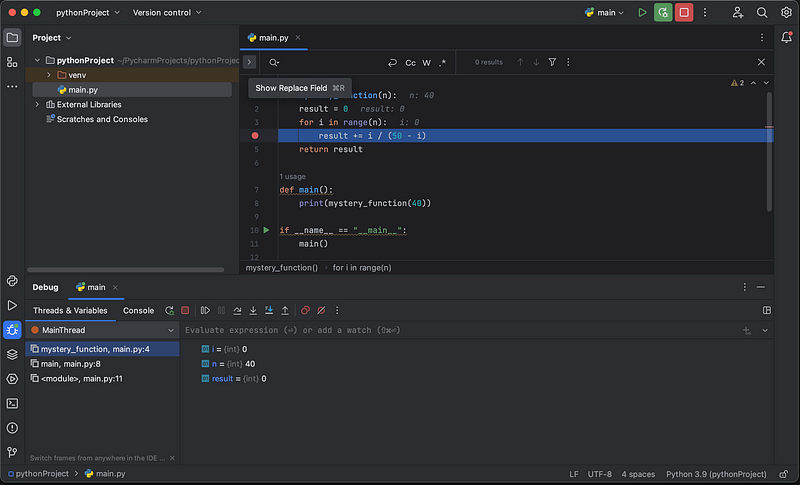
Debugging with PyCharm
PyCharm is a professional Integrated Development Environment (IDE) tailored for Python development. Developed by JetBrains, it’s known for its robust features, including an efficient and user-friendly debugger. Here’s a snapshot of the debugging features PyCharm offers:
- Visual Debugging: PyCharm provides a graphical interface for debugging, making it easy to navigate through the code. It allows you to set breakpoints, step through your code, inspect variables, and view the call stack.
- Smart Step Into: This feature lets you choose the function you want to step into when several functions call on a line.
- On-the-fly Debugging: PyCharm checks your breakpoints and instantly shows if they are valid.
- Inline Debugging: PyCharm displays variable values right next to their usages in the editor, making monitoring the state of variables easier during the debug session.
- Django Debugging: If you’re developing a Django application, PyCharm provides specific debugging support for Django templates.
- Multi-Process Debugging: PyCharm allows you to debug multiple processes at once. This is particularly helpful when you’re working with complex applications.
How to use the debugger in PyCharm
Debugging in PyCharm is straightforward. Here’s a simple guide to get you started:
- Open the Python file you want to debug.
- Set a breakpoint in your code by clicking in the left gutter next to the line of code or by placing the cursor on a line and pressing Ctrl+F8 (or Cmd+F8 on Mac).
- Right-click in your code editor and select ‘Debug ‘ to start a debugging session.
PyCharm will start your program and pause execution at the first breakpoint. You can review your code, inspect variables, and modify variable values on the fly. You can also access the Console tab in the Debug tool window, where you can run arbitrary Python code in the context of the process being debugged.
With PyCharm’s advanced debugging features, navigating complex codebases and squashing bugs becomes a more manageable task. Like VS Code, PyCharm’s debugger proves visual debugging can significantly improve debugging.
pdb-clone, a debugging tool for special cases
In Python development, debugging is an inevitable part of the process. Among numerous debugging tools available, pdb-clone stands out due to its unique ability to support remote debugging.
pdb-clone is essentially a clone of the original pdb, Python’s built-in debugger. While pdb is a robust tool for local debugging, it lacks certain features necessary for efficient remote debugging. This is where pdb-clone comes in, providing enhanced capabilities tailored explicitly for debugging Python applications running on remote servers.
How does pdb-clone work?
pdb-clone establishes a connection between the debugger running on your local machine and the Python application executing on a remote server. This connection enables you to control the execution of the remote application, inspect the state of the program, and evaluate Python expressions in the context of the program being debugged.
Key Features of pdb-clone
- Remote Debugging: pdb-clone’s core feature is to allow developers to debug Python applications running on remote servers, a capability that the standard pdb debugger lacks.
- Breakpoints: Like pdb, pdb-clone allows you to set breakpoints in your code, which will pause the execution of your program at specified points and allow you to inspect the program's current state.
- Stepping through Code: pdb-clone lets you step through your code line by line, so you can understand exactly how your code is executing and where potential issues may lie.
- Inspecting Variables: pdb-clone allows you to review the values of variables at any point in your program, which can be very useful for understanding how data is being manipulated throughout your program’s execution.
- Evaluating Expressions: With pdb-clone, you can evaluate arbitrary Python expressions when debugging the program.
To get the most out of pdb-clone, it’s essential to understand its unique features and how they can be utilized to improve the debugging process.
Installing pdb-clone
pdb-clone is a Python package, so you can install it using pip, Python’s package manager. Open your terminal or command prompt and run the following command: pip install pdb-clone
This will download and install pdb-clone on your local machine. Note that if you’re using a system where Python 3 is not the default, you might need to use pip3 instead of pip.
Using pdb-clone
Using pdb-clone for remote debugging involves two main steps:
- Starting the Debug Server: On the remote machine where your Python application is running, you need to import pdb-clone and set a breakpoint in your code at the point where you want to start debugging. You can do this by inserting the following lines of code:
import pdb_clone
pdb_clone.set_trace()
When the Python interpreter reaches the set_trace() call, it will pause execution and start a debug server waiting for a debug client's connection.
2. Connecting the Debug Client: On your local machine, you start the pdb-clone client and connect it to the debug server. This is done through the command line by running the following command:
pdb-clone <hostname> <port>Here, <hostname> is the IP address or hostname of the remote machine, and <port> is the port number that the debug server is listening on. You can get the port number from the output of the set_trace() call on the remote machine.
Once the debug client is connected to the debug server, you can use the standard pdb commands to control the execution of your program, inspect variables, and evaluate expressions. Here are a few of the most commonly used pdb commands:
n(ext): Execute the following line within the current function.s(tep): Execute the next line, stepping into function calls, if any.c(ontinue): Continue execution until the next breakpoint.p(rint) <expression>: Evaluate and print the value of<expression>.q(uit): Quit the debugger and exit.
Remember, pdb-clone is a powerful tool but requires careful handling. Always follow safe practices when debugging, especially when dealing with remote systems.
Comparing Python Debugging Tools: Pros, Cons, and Use Cases
This section will compare several Python debugging tools, including pdb, pdb++, ipdb, pudb, VSCode, PyCharm, and pdb-clone. We’ll explore the pros and cons of each and discuss situations where one might be preferred over another.
pdb
Pros: pdb is Python’s built-in debugger and is readily available in any Python environment without requiring additional installation. It provides essential debugging features such as setting breakpoints, stepping through code, and inspecting variables.
Cons: pdb’s command-line interface may feel minimalistic or antiquated compared to modern IDEs. It lacks advanced features such as remote debugging and visualization of data structures.
Best for: pdb is ideal for quick and straightforward debugging in a local environment, especially when advanced features are unnecessary or other tools are unavailable.
pdb++
Pros: pdb++ is an extension of pdb that provides several enhancements, including syntax highlighting, sticky mode (which always shows the current context), and improved tab completion.
Cons: While pdb++ improves upon pdb in many ways, it still has a command-line interface that may appeal to some. It cannot also do remote debugging.
Best for: pdb++ is a good choice for developers who appreciate the simplicity of pdb but desire additional features to enhance their debugging experience.
ipdb
Pros: ipdb is another pdb extension that integrates with IPython, providing features like syntax highlighting, advanced tab completion, and integration with Jupyter notebooks.
Cons: ipdb requires IPython, which might be an overkill for simple scripts or environments where IPython is unnecessary. It also lacks remote debugging support.
Best for: ipdb is excellent for debugging in IPython environments, including Jupyter notebooks.
pudb
Pros: pudb offers a full-screen, console-based interface that makes navigating code and inspecting variables easier. It provides features such as syntax highlighting and code stepping.
Cons: Although its interface is more advanced than pdb’s, pudb is still less feature-rich than full-fledged IDEs. It also does not support remote debugging.
Best for: pudb is ideal for developers who prefer a more visual interface than pdb but don’t require the complexity of a full IDE.
VSCode
Pros: VSCode is a powerful IDE that includes a robust Python debugger with a visual interface, variable inspection, integrated terminal, and support for remote debugging.
Cons: VSCode can be overkill for simple projects or quick debugging sessions. It also requires more resources and has a steeper learning curve than command-line debuggers.
Best for: VSCode is suitable for developers who require a full-featured IDE and appreciate the integration of code editing and debugging in one tool. It’s also great for remote debugging.
PyCharm
Pros: PyCharm is a comprehensive IDE explicitly designed for Python. It offers robust debugging tools, code completion, project management, and more. It also supports remote debugging.
Cons: PyCharm is resource-intensive and may be too complex for simple projects. Its extensive features can also be overwhelming for beginners.
Best for: PyCharm is best for large-scale projects or teamwork. It’s also an excellent choice for remote debugging and when you need deep integration with other JetBrains tools.
pdb-clone
Pros: pdb-clone is explicitly designed for remote debugging, filling a niche many other debuggers don’t cover. It provides the essential features of pdb, with the added capability of debugging Python applications running on remote servers.
Cons: While pdb-clone is powerful, its command-line interface may feel basic compared to full-featured IDEs. Additionally, it doesn’t offer advanced features like syntax highlighting, code stepping, or data visualization.
Best for: pdb-clone is ideal when the need for remote debugging arises. It is beneficial when working on server-side applications or debugging issues in specific server environments.
Conclusion
Alright, you made it! So, we’ve had a whirlwind tour of the debugging landscape in Python, haven’t we? We kicked things off with the built-in debugger, pdb, like Python’s version of a Swiss Army knife — simple, reliable, but lacking some fancy features.
Then we stepped it up a notch with pdb++ and ipdb, like pdb’s cooler cousins. They have all the reliable functionality of pdb but with some extra bells and whistles to make your life easier.
We also checked out a few visual debuggers like PuDB, Visual Studio, and PyCharm. These are like the sports cars of Python debugging tools — slick, fast, and with a whole bunch of shiny features. But, like sports cars, they can be a bit of a handful if you’re not used to them.
Then we looked at pdb-clone, a niche tool that comes into its own for remote debugging. It’s like that weird kitchen gadget you didn’t know you needed until you found the perfect recipe.
Finally, we compared all these debuggers, looking at their pros, cons, and where they shine. It’s like trying to pick your favorite ice cream flavor — they’re all good, but depending on the day, you might prefer one.
So, what’s the takeaway from all this?
Well, there's no one-size-fits-all solution for debugging in Python. It’s all about finding the tool that fits your needs, style, and task. And remember, the best debugger is the one that helps you squash those pesky bugs and get back to writing awesome code!
Happy debugging!
More content at PlainEnglish.io.
Sign up for our free weekly newsletter. Follow us on Twitter, LinkedIn, YouTube, and Discord.